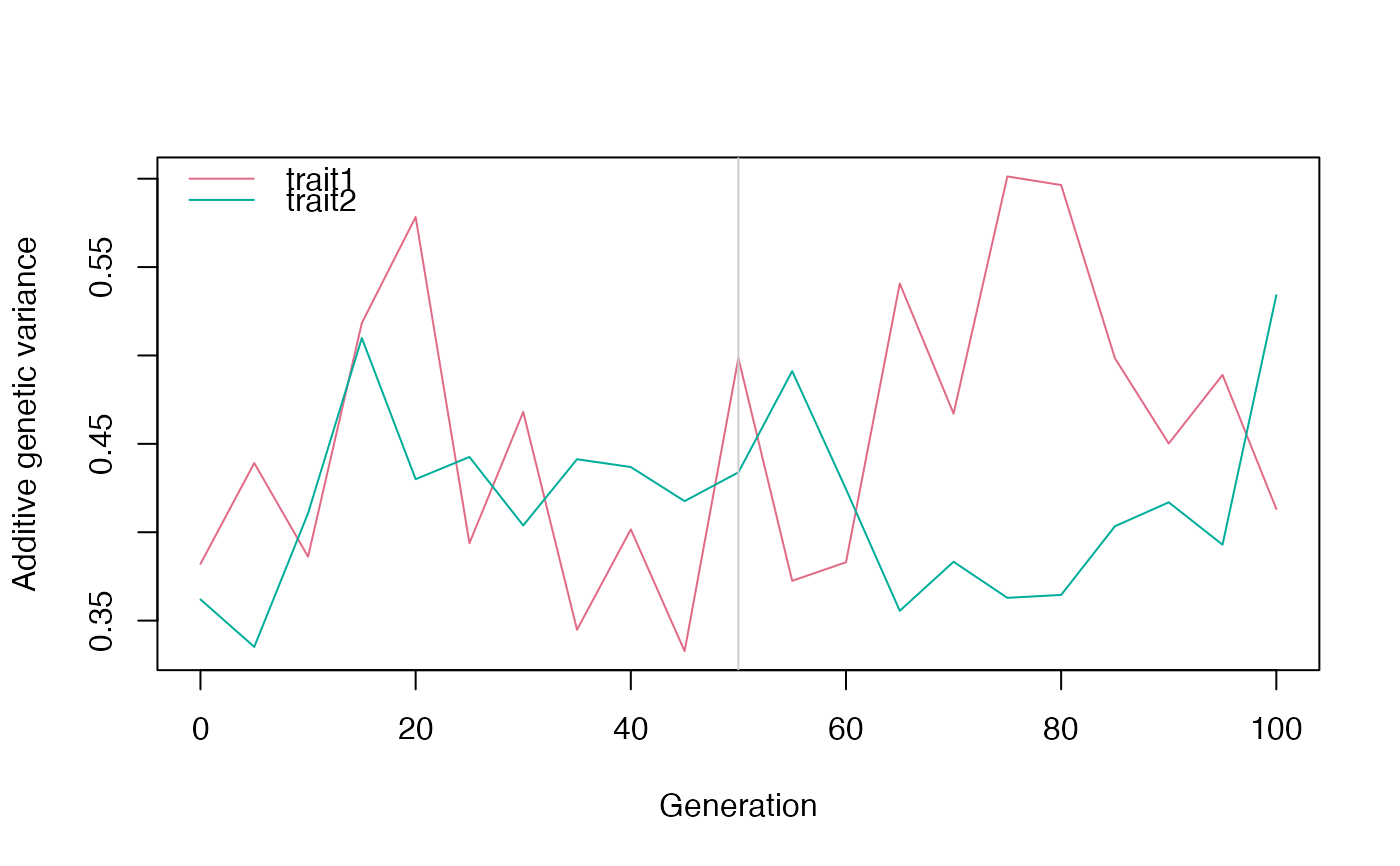
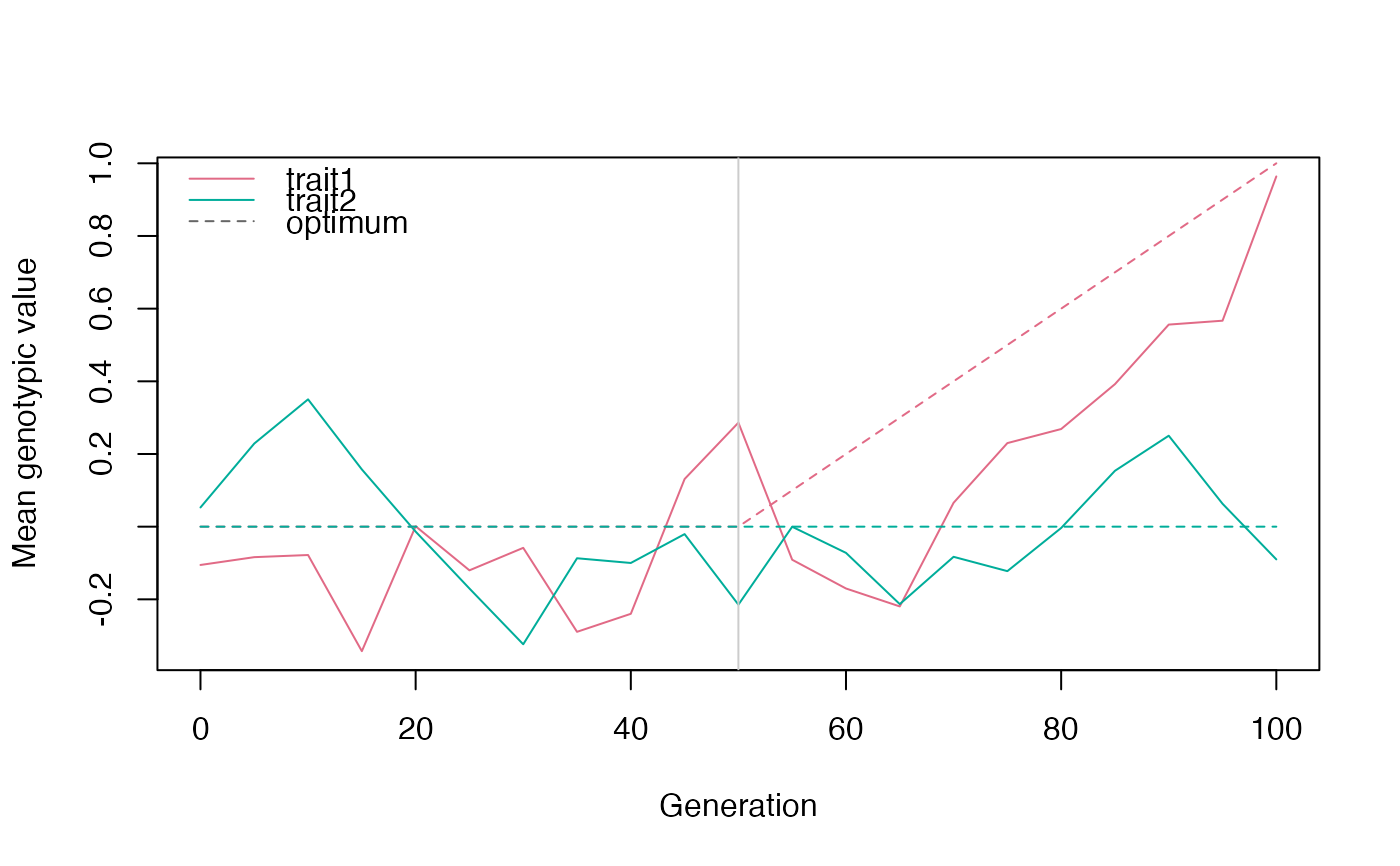
Base-graphics plots of the recorded statistics through time: mean
genotypic values and optima ("means"), additive genetic variances
("variances"), or the genetic correlation between two traits
("correlation"). Regime boundaries are marked with vertical lines.
Arguments
- x
an
evomod_population.- what
which statistic to plot.
- traits
for
"correlation", the two traits to correlate.- ...
passed to
graphics::matplot().
Examples
model <- evomod_model(additive(loci = 20, traits = 2),
mutation(rate = 0.01, cov = 0.1), env_sd = 1, init_sd = 0.1)
pop <- evolve(model, list(stabilizing(50, omega = 10),
directional(50, delta_theta = c(0.02, 0), omega = 10)),
n = 100, record_every = 5, seed = 1)
plot(pop)
 plot(pop, "variances")