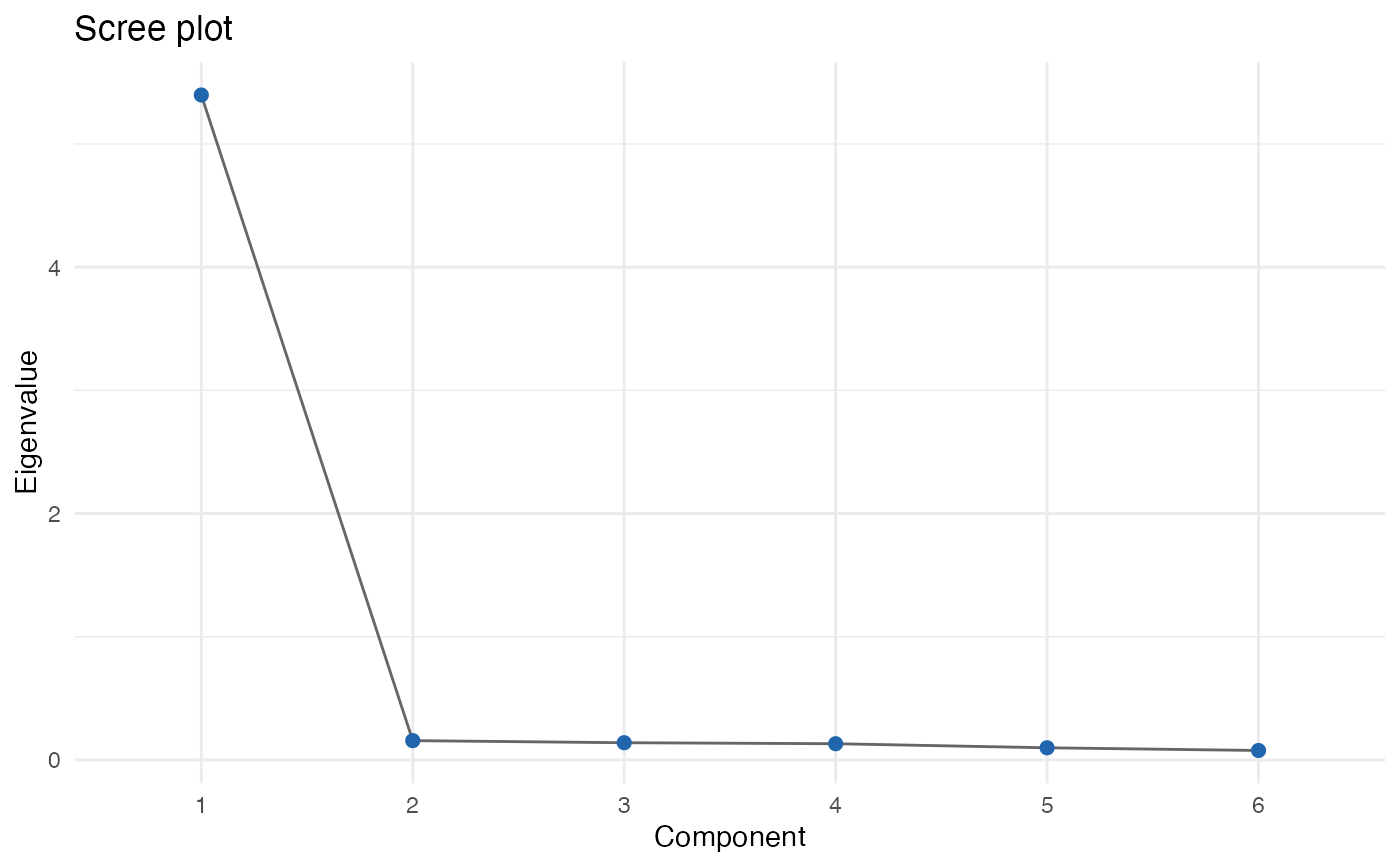
The eigenvalues behind a scree plot, for choosing n_factors in the
sparse factor models. The traits are residualized on X first, so the
eigenvalues describe the correlation the factor model actually fits.
Arguments
- Y
Numeric matrix of traits, individuals in rows.
- X
Optional finite numeric fixed-effects matrix with the same rows as
Y, as inlmm_animal. The defaultNULLuses an intercept only, which is the same as centering the traits.
Value
A data frame of class scree with one row per component and
columns component, eigenvalue, share and
cumulative. share is the eigenvalue divided by the number of
traits and cumulative is its running total.
Details
A factor contributes at most one eigenvalue to this decomposition,
so the number of eigenvalues that stand out above the noise floor is an
upper bound on a useful n_factors. Use
suggest_n_factors to turn that into a number, and
plot.scree to look at it.
Examples
set.seed(1)
P <- random_covariance(6, method = "factor", integration = 0.8)
Y <- matrix(stats::rnorm(300 * 6), 300) %*% chol(P)
colnames(Y) <- paste0("t", 1:6)
scree <- scree_eigenvalues(Y)
scree
#>   component eigenvalue      share cumulative
#> 1         1 5.39746420 0.89957737  0.8995774
#> 2         2 0.15648373 0.02608062  0.9256580
#> 3         3 0.13954226 0.02325704  0.9489150
#> 4         4 0.13147305 0.02191218  0.9708272
#> 5         5 0.09846155 0.01641026  0.9872375
#> 6         6 0.07657521 0.01276253  1.0000000
plot(scree)