R/plots.R
plot_corr.Rd
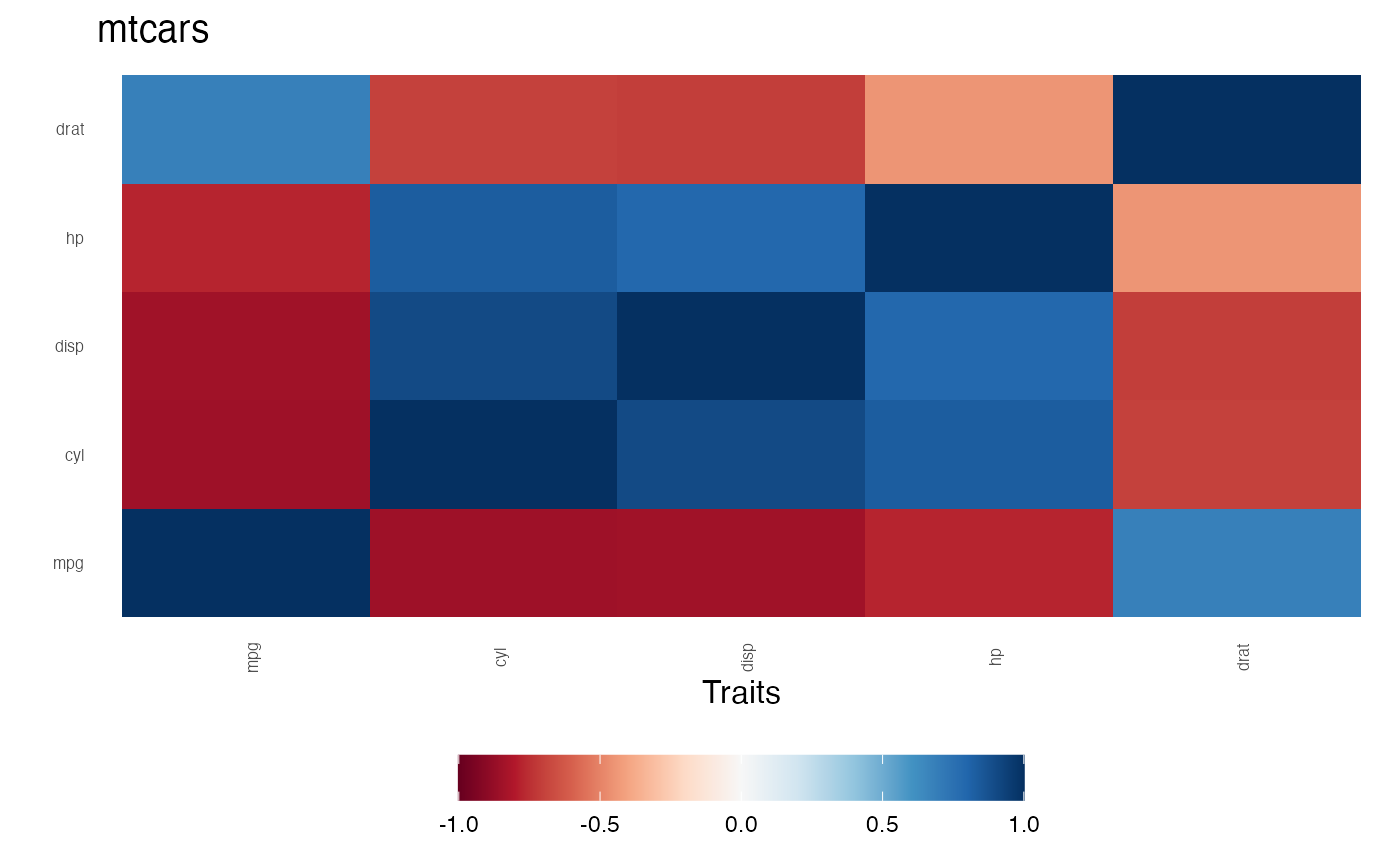
Heatmap of a correlation matrix
plot_corr(M, title = "")
Correlation matrix, with optional row and column names.
Plot title.
A ggplot object with a diverging red-blue scale fixed to [-1, 1].
plot_corr(stats::cor(mtcars[, 1:5]), "mtcars")