tutorials
A gramática dos gráficos: uma introdução usando ggplot2
author: Diogo Melo date: 2019/10/29 font-family: ‘Helvetica’ width: 1366 height: 768
Grammar of graphics
left: 35%
- Uma gramática define um conjunto de regras para uma linguagem.
- Essas regras definem como relacionar elementos para formar sentenças.
- A gramática permite criar gráficos utilizando uma sintaxe declarativa.

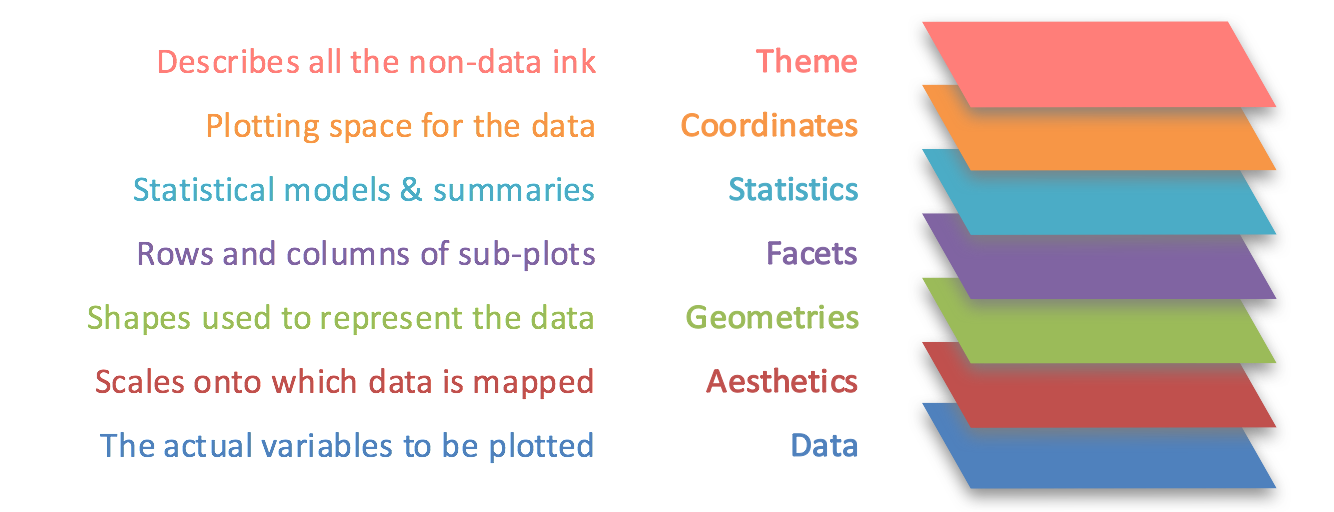
Elementos da gramática

ggplot2
left: 35%
“ggplot2 is a plotting system for R, based on the grammar of graphics, which tries to take the good parts of base and lattice graphics and none of the bad parts. It takes care of many of the fiddly details that make plotting a hassle (like drawing legends) as well as providing a powerful model of graphics that makes it easy to produce complex multi-layered graphics.”

Data
- Dados a serem plotados;
- Definido pelo argumento data;
- No ggplot2, SEMPRE um data.frame;
- Cada linha é uma observação;
- Frequentemente é necessario alternar data.frame no formato narrow e wide;
Data - formato wide
head(iris, 10)
   Sepal.Length Sepal.Width Petal.Length Petal.Width Species
1           5.1         3.5          1.4         0.2  setosa
2           4.9         3.0          1.4         0.2  setosa
3           4.7         3.2          1.3         0.2  setosa
4           4.6         3.1          1.5         0.2  setosa
5           5.0         3.6          1.4         0.2  setosa
6           5.4         3.9          1.7         0.4  setosa
7           4.6         3.4          1.4         0.3  setosa
8           5.0         3.4          1.5         0.2  setosa
9           4.4         2.9          1.4         0.2  setosa
10          4.9         3.1          1.5         0.1  setosa
Data - formato narrow
library(tidyr)
head(
  gather(iris, trait, value, Sepal.Length:Petal.Width),
  10)
   Species        trait value
1   setosa Sepal.Length   5.1
2   setosa Sepal.Length   4.9
3   setosa Sepal.Length   4.7
4   setosa Sepal.Length   4.6
5   setosa Sepal.Length   5.0
6   setosa Sepal.Length   5.4
7   setosa Sepal.Length   4.6
8   setosa Sepal.Length   5.0
9   setosa Sepal.Length   4.4
10  setosa Sepal.Length   4.9
Conversão narrow/wide
- Várias opções…
- Vintage:
- pacotes reshape, reshape2
- Funções melt() (wide -> narrow) , cast() (narrow -> wide)
- pacotes reshape, reshape2
- Moderno:
- pacote tidyr
- Funções:
- gather(), pivot_longer() (wide -> narrow)
- spread(), pivot_wider() (narrow -> wide)
Aesthetics
- Relações entre aspectos gráficos e variáveis;
- Definido pela função aes()
- Na aes(), esses aspectos devem ser defindos pelos dados (por uma coluna do data.frame)
- Define:
- Eixos x e y;
- Agrupamentos;
- Cores;
- Animações…
Geometries
- Forma de representar os dados;
- Definido pelas funções geom_*:
- Linhas (geom_lines(), geom_segment())
- Pontos (geom_points(), geom_jitter())
- Densidade (geom_density(), geom_raster(), geom_hex(), geom_density_ridges())
- Histograma (geom_histogram())
- Boxplot (geom_boxplot(), geom_violin())
- E grande elenco…
ggplot mínimo
Regra geral:
ggplot(data_frame_entrada, aes(x = coluna_eixo_x,
                               y = coluna_eixo_y,
                               group = coluna_agrupadora,
                               color = coluna_das_cores))
+ geom_tipo_do_grafico(opcoes que não dependem dos dados,
                       aes(opcoes que dependem))
Scatter plot
ggplot(data = iris, aes(Sepal.Length, Sepal.Width)) + geom_point()

Scatter plot - Species mapeado nas cores
ggplot(data = iris, aes(Sepal.Length, Sepal.Width,
                        color = Species)) +
  geom_point()

Histograma
ggplot(diamonds, aes(price)) + geom_histogram(bins = 500)

Facets
- Criar mais de um gráfico independente;
- Separa dados em sub-gráficos a partir de uma variável categórica;
- Geralmente dado por uma formula, pode ser uma ou mais variáveis:
- Uma variável: facet_wrap()
- Duas ou mais variáveis: facet_grid()
Facets
ggplot(data = iris, aes(Sepal.Length, Sepal.Width)) +
  geom_point(aes(color = Species)) + facet_wrap(~Species)

Statistics
- Elemento derivado dos dados brutos;
- No geral são embutidos em algum geom_
- Resumos usando estatísticas: geom_boxplot()
- Funções de regressão: geom_smooth()
- Reta de regressão linear: geom_smooth(method=”lm”)
Statistics - regressão não-linear (loess)
ggplot(data = iris, aes(Sepal.Length, Sepal.Width,
                        color = Species)) +
  geom_point() + geom_smooth()

Statistics - regressão linear (lm)
ggplot(data = iris, aes(Sepal.Length, Sepal.Width,
                        color = Species)) +
  geom_point() + geom_smooth(method = "lm")

Statistics - boxplot + jitter
library(tidyr)
narrow_iris = pivot_longer(iris, -Species)
ggplot(narrow_iris, aes(Species, value)) +
  geom_boxplot() + geom_jitter(width = 0.2, height = 0) + facet_wrap(~name, scales="free")

Statistics - boxplot + dotplot
library(tidyr)
narrow_iris = pivot_longer(iris, -Species)
ggplot(narrow_iris, aes(Species, value)) +
  geom_boxplot() + geom_dotplot(binaxis = 'y',
        dotsize = 0.5,
        stackdir = 'center') + facet_wrap(~name, scales="free")

Coordinates
- Mudanças nos eixos e escalas (cor, forma, tamanho…)
- Definido pelas funções scale_
- Eixos: scale_y_continous(), scale_x_discrete(), …
- Escalas de cor: scale_color_* (scale_color_continuous(), scale_color_discrete())
- Escalas de shape: scale_shape_* (scale_shape_continuous(), scale_shape_discrete())
Theme
- Tudo que não tem nada a ver com os dados
- Fontes;
- Tamanhos;
- Fundo;
- Posição de legendas e texto;
- Definido pela função theme()
- Ou usando temas prontos!
- Tem vários, é ótimo!
ggplot - objetos graficos
left: 60%
-
No ggplot os objetos gráficos podem ser manipulados ou armazenados, diferente dos plots padrão onde os gráficos são “efeitos colaterais”
-
Isso significa que vc pode alterar gráficos já feitos usando “+”
library(gapminder)
meu_grafico = ggplot(gapminder, aes(x = log(gdpPercap), y = log(lifeExp))) + geom_point(aes(color = continent))
meu_grafico

ggplot - objetos graficos
left: 60%
Algumas opções comuns:
meu_grafico = meu_grafico +
    labs(x = "GDP per capta",
         y = "Expectativa de vida")

meu_grafico = meu_grafico + theme(text = element_text(size = 30), legend.title = element_text(face = "italic")) + scale_color_discrete(name = "Continente")
meu_grafico

ggplot - temas
left: 30%
Temas prontos!
library(cowplot)
meu_grafico = meu_grafico + theme_cowplot()
meu_grafico

ggplot - temas
Temas prontos!
library(ggthemes)
meu_grafico = ggplot(gapminder,
 aes(x = log(gdpPercap),
     y = log(lifeExp))) +
  geom_point(size = 3,
  aes(shape = continent)) +
  theme_wsj()
meu_grafico

ggplot - outros tipos de gráficos
Documentação
- Documentação oficial (help não costuma ajudar) - http://docs.ggplot2.org/current/
- Livro de visualização moderno feito inteiro em ggplot2 - https://serialmentor.com/dataviz/
- How to format plots for publication using ggplot2 - http://www.noamross.net/blog/2013/11/20/formatting-plots-for-pubs.html
- http://stackoverflow.com/